
Archived GIS Snippets
Published in 2013
Permanent URL
Do-It-Yourself GIS: 20 Free Tools & Data Sources for Creating Data MapsIS: 20 Free Tools & Data Sources for Creating Data Maps
by ellyssa kroski
The world of mapping and presenting data sets through geographical representations is no longer relegated to GIS librarians and highly trained technologists. New free and open source applications now make it possible to create complex and robust data visualizations in the form of maps that display statistics and poll results. Here’s a guide to 20 free applications and data sources continued…
first published week of: 08/26/2013
Permanent URL
Dynamic Two Way Real Time Map – Using SignalR and Google Maps
by sleepycrat
The goal of this article will be to show an example of two way communication between a web application and its connected users. We will make a web page containing a map which will dynamically update itself in real time for any user viewing the page when a user submits a location to it.
Google Maps
Google Maps is a web mapping service application. It provides users with services such as creating visual maps and services such as geo-coding. Luckily for us, they also provide a very friendly and well documented API for developer use.
For this tutorial, you will need to be able to access Google’s Mapping API and other related services. This link will guide you through the process of creating a Google API developer account and how to turn on access to the Map API. When you are done with this process, you should have access to what is known as your API "key". This key will be used later in the tutorial to make service calls to the JavaScript API. Note: There are some usage restrictions that are applied with the free use of Google’s APIs. Review the details and user agreement carefully. continued…
first published week of: 03/11/2013
Permanent URL
Dynamics CRM / XRM Integration with GIS and PowerMap
by joecrm
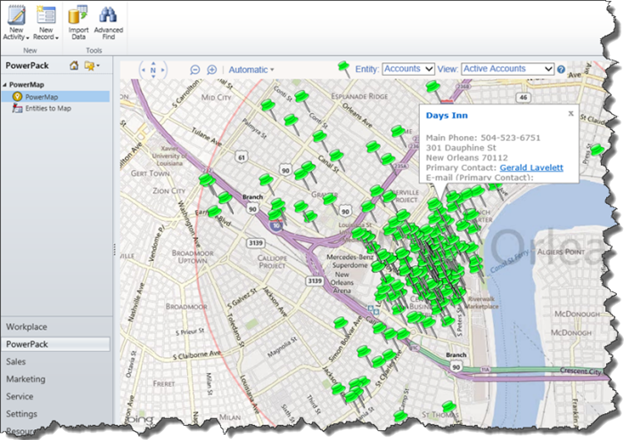
Over the last several years, a new dimension has been added to reporting in Dynamics CRM: visualization. PowerObjects has taken visualization a step further by introducing maps into XRM solutions. It’s a little thing we call PowerMap—another inexpensive and great add-on by PowerObjects that installs in a few clicks and does magic when it comes to data visualization.
PowerMap takes addresses from your CRM and plots them on a map in the form of pins. With it, you can look at all your leads, accounts and contacts on a map. You can use PowerMap to create business plans based on lead/account/contact locations, for reporting (just click on a pin to get more details), to see what clients are located nearby when you travel for a conference, to make your CRM look cool…the opportunities are endless. And because we are constantly improving our products, future versions of PowerMap will have even more functionality, such as different colored pins for different types of customers, heat maps, routing, and directions.
As an example of how PowerMap can be used, let’s take a look at a recent project where PowerObjects helped a county in rural Minnesota integrate their GIS (Geographic Information System) with Dynamics CRM 2011. (We even got a nice little write-up about the project in MS Dynamics World.) continued…
first published week of: 05/20/2013
Permanent URL
Eagle Technology delivers always-on GIS solutions with IBM SmartCloud Virtual Server Services
Eagle Technology, an IT solutions company specializing in geographic information systems (GIS) and enterprise solutions, found they needed a simple, fast-to-deploy cloud platform for on-demand business needs in order to address the complexity and timeframes associated with traditional on-premises enterprise application deployment.
In this whitepaper, you’ll discover the steps Eagle Technology took to find a cloud solution that not only helped serve their clients better, but also allowed them to drive more attention to the GIS market as a whole. Read on to hear their story. Get full report here (registration required)
first published week of: 08/12/2013
Permanent URL
EagleView Technologies and Pictometry International Announce Merger
Increased Scale, Diversification and Synergies in Imaging & Analytic Capabilities Expected to Drive Continuing Growth and Accelerated Innovation
EagleView® Technologies, the leading provider of automated® 3D measurement technologies and analysis solutions and Pictometry® International, the leader in geo-referenced aerial image capture and visual-centric data analytics, jointly announced today that they have entered into a definitive merger agreement under which EagleView and Pictometry have combined their businesses into a single entity. EagleView and Pictometry closed the transaction on January 7, 2013.
The merger creates a global leader providing unparalleled geo-referenced aerial imagery and analytical software solutions servicing both government and commercial customers. The new entity will offer comprehensive and robust capabilities in aerial imagery collections, geospatial analytics and 3D measurement technologies. A more diversified revenue base, greater financial resources, advanced product capabilities and significant growth opportunities will reach across current industry segments – including local and regional government, insurance, energy and utilities and construction – as well as additional verticals.
Chris Barrow, EagleView’s chief executive officer, will lead the management team of the combined company as its president and chief executive officer, while Pictometry’s chief executive officer, Rick Hurwitz, will exit the business having worked closely with both companies in support of this transaction. This fulfills his vision to develop Pictometry into an end-to-end solutions provider that derives actionable information from aerial images. The management team of the new company will draw on a talented group of executive leaders from both companies with the six-member board of directors comprised of three EagleView directors and three Pictometry directors. The company will operate with offices in Bothell, Wash. and Rochester, NY while also maintaining satellite offices in other locations.
first published week of: 01/14/2013
Permanent URL
Embedding ArcGIS Online web maps in iBooks
by bern szukalski
Embedding maps on the web is a great way to bring your content to places it will benefit people the most such as blog posts, news articles, and press releases. Another place that web maps can be embedded is in electronic textbooks that support web content.
Apple’s iBooks app supports a new generation of e-textbooks that are easy to navigate on the iPad’s touchscreen and can contain many types of interactive content in addition to standard images and text. A few weeks ago, at their recent WWDC developer conference, Apple announced the next version of Mac OS X, due out later this year, will support these iBooks textbooks on laptop and desktop computers.
This post explains how to embed our favorite type of HTML web content – ArcGIS Online web maps – in an iBook. To see what this looks like, you can download this example iBook that has an example map, app, and gallery.
What you’ll need continued…
first published week of: 06/24/2013


 ♦
♦ 